![]() A plain-language guide to the grading system behind 2D barcode quality
A plain-language guide to the grading system behind 2D barcode quality
Most people who deal with barcodes professionally have heard the term “ISO grade” — a letter or number that tells you whether a symbol passed or failed a quality test. What almost nobody outside the verification industry can explain is what that grade is actually built from, or what physical printing problem each component is designed to detect.
That matters now more than ever. As companies transition to 2D symbols — Data Matrix codes for medical devices and pharmaceuticals, QR codes for retail and GS1 Digital Link compliance — they are running into quality failures they didn’t anticipate. The symbols look fine. They scan on the test scanner at the print station. And then they fail at the point of care, at the automated warehouse conveyor, or at the retail point of sale. The grade would have told them why. But only if they understood what the grade was measuring.
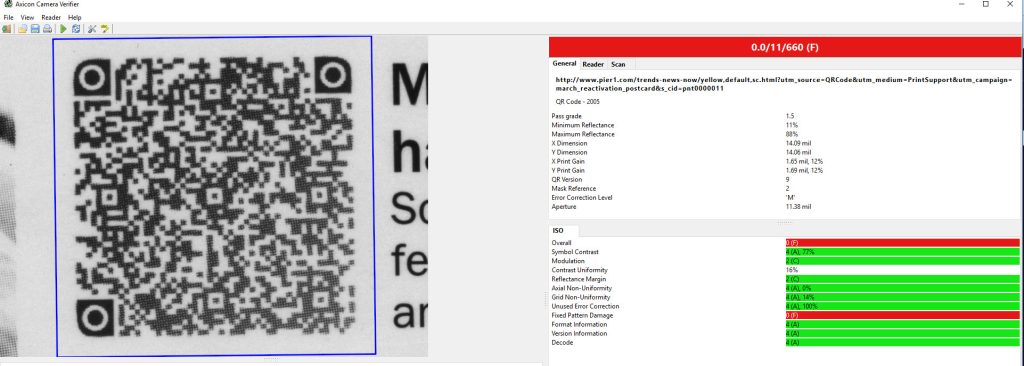
ISO/IEC 15415 is the international standard that defines how 2D barcode symbols — primarily Data Matrix and QR Code — are graded. It specifies seven parameters, each of which isolates a different dimension of print quality. The overall grade is the lowest grade among all seven. Think of it as the weakest link: a symbol that scores A on six parameters but D on one still receives a D.
Here is what each parameter measures, why it exists, and what print defect it is designed to catch.

Parameter 1: Decode
What it measures: Can the symbol be decoded at all?
This is the most fundamental test, and the only one that is strictly pass/fail. The verifier attempts to decode the symbol using a reference decode algorithm — a standardized software decoder designed to be consistent across measurements, not optimized for real-world tolerance. If the symbol decodes, this parameter passes with a grade of 4 (equivalent to A). If it does not decode, the entire symbol receives a failing grade regardless of how well it scores on every other parameter.
Why it exists: A symbol that cannot be decoded by the reference algorithm has failed at the most basic level. No amount of good contrast or clean geometry can compensate for a symbol that simply cannot be read. Decode failure typically indicates severe module damage, catastrophic ink spread, or fundamental printing errors such as a skipped print head element that leaves an entire column of modules missing.
The practical catch: Decode failure is usually obvious. The more insidious quality problems are the ones that pass decode but degrade the other six parameters — producing a symbol that can be read under ideal conditions but fails under the real-world scanning environments your supply chain actually contains.

Parameter 2: Symbol Contrast
What it measures: The difference between the lightest and darkest areas in the symbol, expressed as a percentage of the total reflectance range the verifier can measure.
Symbol Contrast is calculated as R-max minus R-min — the reflectance of the lightest element minus the reflectance of the darkest element. A symbol printed in dense black ink on bright white label stock will show a large contrast value. A symbol printed on a colored substrate, a glossy surface, or with faded ink will show a much smaller one.
Why it exists: Scanners decode barcodes by detecting the transition between light and dark. The larger the contrast difference, the more reliably a scanner can distinguish a dark module from a light one. When contrast is low, the signal the scanner receives is ambiguous — marginal illumination angles, slight surface variations, or minor label damage can push a module’s reflectance to the wrong side of the threshold, causing a misread.
The practical catch: Symbol Contrast catches problems that are invisible at normal inspection distances. A label that looks perfectly printed under the fluorescent light at your receiving dock may have dangerously low contrast under the near-infrared illumination many industrial scanners use. A verifier measures contrast under calibrated, standardized conditions — the human eye cannot replicate this reliably.
Parameter 3: Modulation
What it measures: How consistently each individual module achieves its intended reflectance value, relative to the overall contrast range of the symbol.
Where Symbol Contrast measures the distance between the lightest and darkest elements overall, Modulation looks at whether the individual dark modules are consistently dark and the individual light modules are consistently light. A symbol can have acceptable overall contrast but poor Modulation if some dark modules are printing lighter than others — perhaps because of ink starvation in one region of the label, thermal print head wear, or substrate texture variation.
Why it exists: A decoder determines whether a given module is dark or light by comparing its reflectance to a threshold — typically the midpoint between R-max and R-min. If a dark module’s reflectance is closer to the midpoint than it should be, there is less margin for error. Any real-world degradation — a scratch, a smudge, variable lighting — can push that module past the threshold and cause a misread.
The practical catch: Low Modulation is a leading indicator of print process instability. It often reveals ribbon age, substrate inconsistency, or print head condition problems before they become visible as defects or cause scan failures. Catching low Modulation early is considerably cheaper than a product recall or a compliance rejection.

Parameter 4: Fixed Pattern Damage
What it measures: The integrity of the structural elements the decoder uses to locate, orient, and interpret the symbol — the finder pattern, quiet zone, timing patterns, and alignment patterns.
Every 2D symbology has regions that serve not as data storage but as navigation aids for the decoder. In a Data Matrix symbol, these are the solid “L” shaped border (the finder pattern) and the alternating light-dark border opposite it (the timing pattern). In a QR Code, they are the three large square patterns in three corners, plus the alignment patterns distributed throughout larger symbols. Fixed Pattern Damage measures how intact these structural elements are.
Why it exists: A decoder that cannot locate or orient the symbol cannot read it, regardless of how well the data modules are printed. Fixed Pattern Damage is graded more harshly than damage to data modules because of this asymmetry: the error correction built into 2D symbols can reconstruct damaged data modules, but it cannot compensate for a corrupted finder pattern.
The practical catch: Fixed Pattern Damage is often caused by die-cutting, perforation, or folding lines that happen to intersect the finder pattern. It can also result from label applicators that smear ink across the leading edge of the symbol during application. Because the finder pattern is located at the symbol’s border, it is disproportionately exposed to physical handling damage — exactly the kind that accumulates between print and final scan.
Parameter 5: Axial Non-Uniformity
What it measures: Whether the symbol’s modules are consistently sized and spaced along both the horizontal and vertical axes, or whether the symbol is stretched or compressed in one direction relative to the other.
Axial Non-Uniformity compares the module pitch — the distance from the center of one module to the center of the next — along the X axis versus the Y axis. A well-calibrated printer produces modules that are square and evenly spaced in both directions. A printer with a high speed setting, a worn platen roller, or a label web that stretches during printing will produce modules that are elongated in one direction. The symbol looks like a rectangle when it should look like a square grid.
Why it exists: Decoders are designed to handle some degree of symbol distortion, but Axial Non-Uniformity beyond tolerance forces the decoder to make assumptions about module placement that increase the likelihood of misread. The effect is most damaging in larger symbols with more modules, where the accumulated positional error across the symbol becomes significant.
The practical catch: Axial Non-Uniformity is almost never visible to the naked eye at the distances typical of label inspection. It requires measurement. It is a common failure mode for thermal transfer printers that have not been calibrated recently, and for continuous-feed printing operations where web tension varies across a print run.
Parameter 6: Grid Non-Uniformity
What it measures: How accurately the center of each individual module falls on the ideal reference grid that the decoder expects.
Where Axial Non-Uniformity measures systematic distortion across the whole symbol, Grid Non-Uniformity measures local, random variation in module placement. Even if the overall symbol dimensions are correct, individual modules can be shifted from their ideal positions by substrate texture, print head element variation, vibration in the print mechanism, or thermal expansion during printing. Grid Non-Uniformity captures this noise.
Why it exists: A decoder reconstructs the symbol by projecting a reference grid onto the image and sampling the reflectance at each expected module location. If a module’s center has shifted, the sampling point falls on the wrong location — possibly on the border between a dark and a light module — and the decoder misclassifies it. High Grid Non-Uniformity means the decoder is operating with less geometric certainty at every module in the symbol.
The practical catch: Grid Non-Uniformity failures often indicate substrate problems: embossed or textured label materials that physically deflect the print head during printing, or substrates with inconsistent surface absorption that cause ink to spread unevenly. It is also a common symptom of printing on curved or irregular surfaces — which is precisely where direct part marking (DPM) on medical devices or industrial components tends to occur.
Parameter 7: Unused Error Correction
What it measures: How much of the symbol’s built-in error correction capacity remains available after accounting for any damage or degradation the symbol has already sustained.
2D matrix symbologies encode data redundantly. A Data Matrix or QR Code can still be decoded even if a portion of its modules are unreadable, because the error correction algorithm can reconstruct the missing data from the surviving modules. Unused Error Correction measures what percentage of that correction capacity is still intact. A symbol with no damage has 100% of its error correction available. A symbol with some print defects has consumed some of that capacity to compensate for those defects — leaving less margin to absorb future damage during handling and distribution.
Why it exists: A symbol that arrives at its destination with 100% of its error correction intact is not the same as a symbol that barely survived the trip. Both may scan successfully today, but the latter has no remaining tolerance for a scratch, a moisture mark, or a partial obstruction. Unused Error Correction answers the question: how much more damage can this symbol absorb and still be readable?
The practical catch: This parameter directly translates to supply chain resilience. A pharmaceutical label that leaves the printer with a C-grade Unused Error Correction score may scan at the dispensing cabinet — until a drop of water, a handling smear, or a storage crease consumes the remaining capacity. The consequence in a clinical setting is not a failed checkout transaction. It is a scanning failure at the point of medication administration.
How the Parameters Combine Into a Grade
Each parameter is scored on a scale of 0 to 4, where 4 corresponds to a letter grade of A and 0 corresponds to F. The overall symbol grade is the lowest score among all seven parameters — not an average.
This is intentional and significant. A symbol cannot compensate for a critical weakness in one dimension by excelling in others. A symbol with perfect contrast, geometry, and error correction capacity but a damaged finder pattern still fails. This mirrors the real world: a scanner attempting to read that symbol will be stopped by the one thing it cannot work around, regardless of everything else the symbol has going for it.
The grade thresholds are:
| Score | Grade | Interpretation |
| 4 | A | Excellent — robust performance in demanding scan environments |
| 3 | B | Good — acceptable for most applications |
| 2 | C | Marginal — may fail in automated or high-speed scanning |
| 1 | D | Poor — compliance failure in most regulated applications |
| 0 | F | Fail — unacceptable |
Many retailers, healthcare, and pharmaceutical compliance programs specify a minimum grade of 1.5 (between C and D) or higher. GS1 recommends a minimum grade of 1.5 for retail applications; healthcare applications under FDA UDI requirements and pharmaceutical serialization under DSCSA typically require higher minimums and may be specified by the trading partner or regulatory body.
What This Means in Practice
The value of understanding these seven parameters is not academic. Each one points to a specific, addressable root cause in the print process. A Symbol Contrast failure points to ink density or substrate selection. An Axial Non-Uniformity failure points to printer calibration. A Fixed Pattern Damage failure points to die-cutting registration or applicator alignment. Grid Non-Uniformity failures point to substrate or print head condition. Unused Error Correction failures tell you that the symbol is absorbing damage somewhere in the process between print and scan.
A scan test tells you only whether a particular scanner, under particular conditions, could decode the symbol at the moment you tested it. An ISO grade tells you why the symbol performs the way it does, and what margin remains between current performance and failure.
As 2D barcodes become mandatory across retail, healthcare, pharmaceutical, and food supply chains, the difference between those two kinds of information is the difference between reactive troubleshooting and systematic quality control.
![]() Contact us here for information about ISO-compliant barcode testing and verification equipment.
Contact us here for information about ISO-compliant barcode testing and verification equipment.